Today we are showcsing best pure JavaScript charting libraries with support for a number of useful features. These include legend and label support, mouse tracking, tooltips, templates and animations.They provide a wide range of chart types and layouts for interactive web visualisations. These include area, pie and bar charts, sunburst, icicle, treemap, forceDirected, spaceTree.
Here is the handpicked collection of jQuery plugins to display Charts and Graphs.
Chartist – Simple Responsive Charts
 Chartist.js is a simple responsive charting library built with SVG. There are hundreds of nice charting libraries already out there, but they are either:
Plottable.js
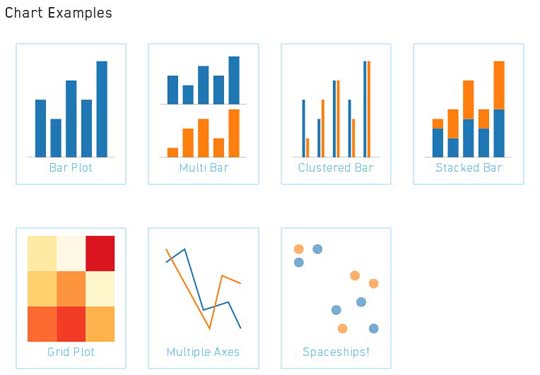 Plottable.js is a library of chart components for creating flexible, custom charts for websites.You can think of Plottable as a “D3 for Charts” – it is not a charting library but a library of chart components.
Chart.js – Open Source HTML5 Charts
 Simple, clean and engaging charts for designers and developers.
Epoch
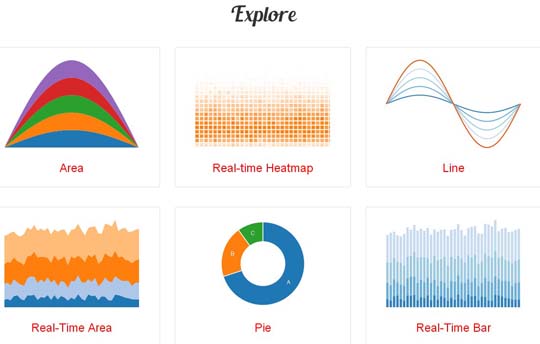 Epoch is a general purpose charting library for application developers and visualization designers. It focuses on two different aspects of visualization programming: basic charts for creating historical reports, and real-time charts for displaying frequently updating timeseries data.
Circliful – jQuery Circle Statistics Plugin
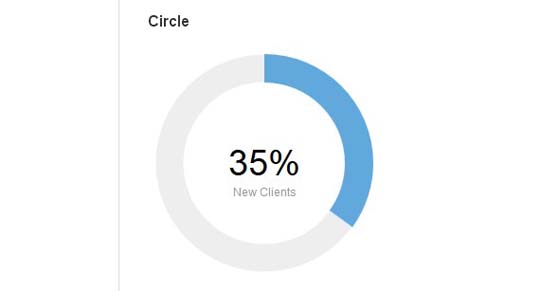 jQuery circle statitic plugin.Show Infos as Circle Statistics, no images used.
Percentage Loader
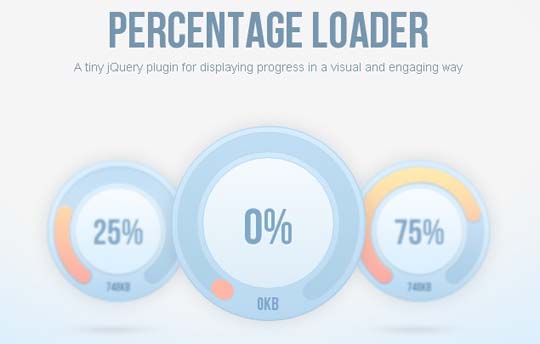 jQuery.PercentageLoader is a jQuery plugin for displaying a progress widget in more visually striking way than the ubiquitous horizontal progress bar / textual counter.
Chartinator – Transform HTML Table Into Google Charts
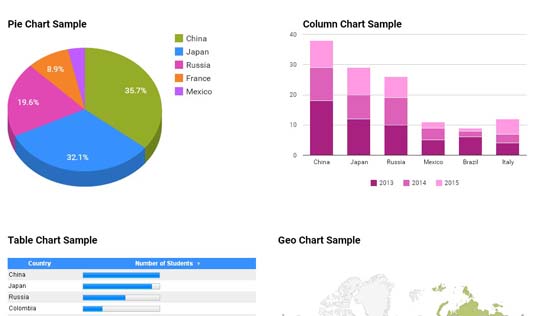 A jQuery plugin for transforming HTML tables into charts using Google Charts
tauCharts – Flexible Javascript Charting Library
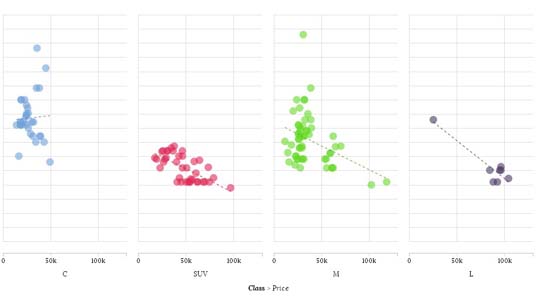 tauCharts is a Javascript charting library based on D3. Designed with passion.
Chartify – Google Charts out of HTML tables
 Chartify is an open source jQuery plugin for visualization using Google Charts. It makes charts from tables!
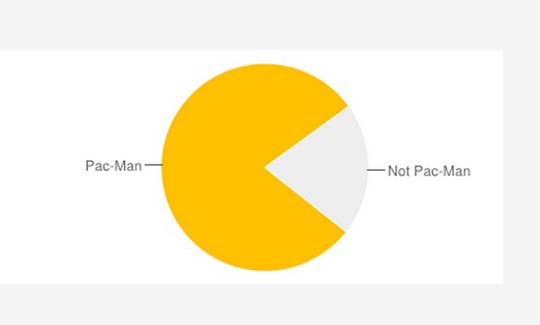
Snazzy Animated Pie Chart with HTML5 and jQuery
 Learn how to use the HTML5 canvas element, CSS3 and jQuery to create a gorgeous, interactive animated pie chart. Full code included for your own use.
ZingChart jQuery
 ZingChart jQuery is a wrapper for the ZingChart charting library that allows for jQuery-style use of the 88 different API methods and 81 different API events that ZingChart has to offer. It’s designed to allow maximum use of the various features with the simplest and most jQuery-esque syntax possible.
ECharts – Interactive Charting Library
 “Drag-Recalculate” feature (patented) brings you the best user experience ever: by allowing you to effectively extract, integrate, or even exchange data among multiple charts, ECharts opens you up every opportunity for data mining and integration.
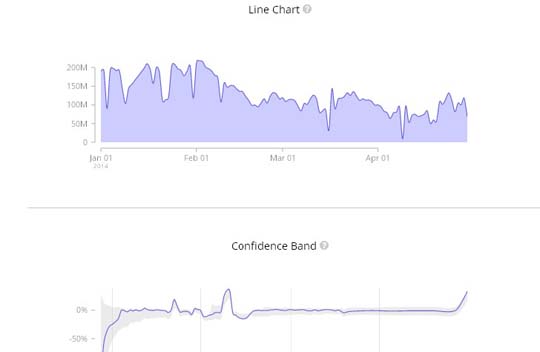
Charted
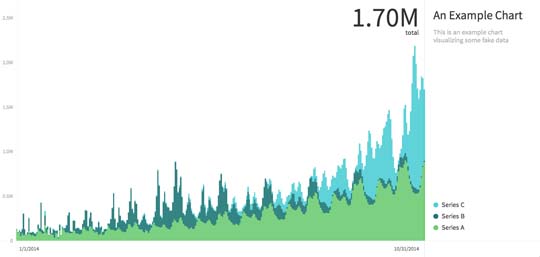 Charted is a tool for automatically visualizing data, originally created by the Product Science team at Medium. Provide the link to a data file and Charted returns a beautiful, interactive, and shareable chart of the data. The charts look like this:
MetricsGraphics.js
 MetricsGraphics.js is a library optimized for visualizing and laying out time-series data. At under 60KB (minified), it provides a simple way to produce common types of graphics in a principled and consistent way. The library currently supports line charts, scatterplots, histograms, bar charts and data tables, as well as features like rug plots and basic linear regression.
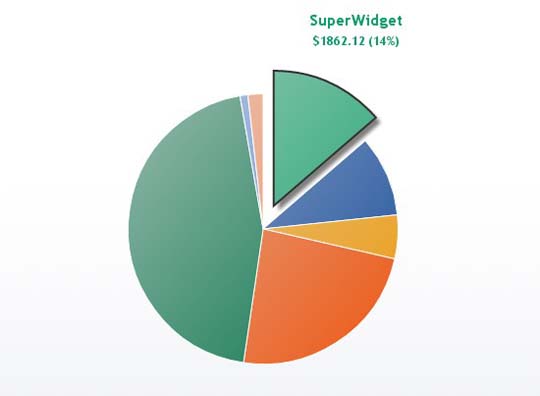
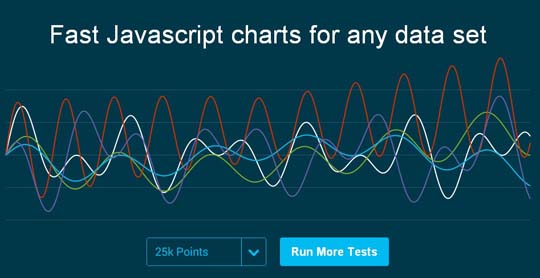
CanvasJS jQuery Charts Plugin
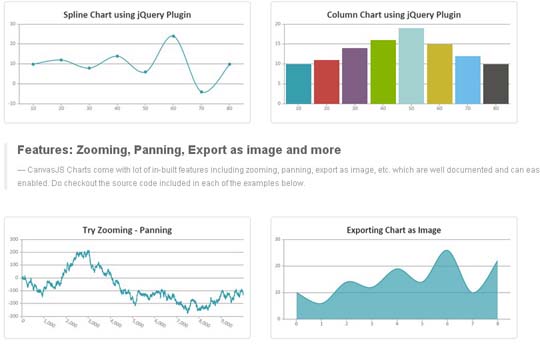 CanvasJS comes with a jQuery Charting Plugin that lets you add interactive charts & graphs to your web page with a few lines of code. If you are someone who uses jQuery extensively, you should feel right at home with this plugin.